
p.23 Exercise 3 (Same exercise as the book, but put on pieces of paper so the students can physically move the sections around) drive, docs, pub
Quickly scan pages 22-25 to find the answers to these questions. The first team to finish gets a prize.
1. How many words must you write for Writing Task 1?
2. How many minutes should you spend on Writing Task 1?
3. Which is worth more points: Writing Task 1 or Writing Task 2?
4. True or False: You should try to explain the reasons behind the data in Task 1.
5. What style should you use for all IELTS essays?
6. What should you write in your first sentences?
7. What are two examples of some useful expressions to link your ideas?
8. True or False: You should write about everything you see.
9. What are the four criteria that the examiners use to grade Writing Task 1?
10. What types of visual information might you be asked to write about?
Answers:
1. How many words must you write for Writing Task 1? 150
2. How many minutes should you spend on Writing Task 1? 20 minutes
3. Which is worth more points: Writing Task 1 or Writing Task 2? Task 2
4. True or False: You should try to explain the reasons behind the data in Task 1. False
5. What style should you use for all IELTS essays? Formal academic style
6. What should you write in your first sentences? An overall description
7. What are two examples of some useful expressions to link your ideas? “in addition” and “however”
8. True or False: You should write about everything you see. false
9. What are the four criteria that the examiners use to grade Writing Task 1? Task achievement, coherence and cohesion, lexical resource, grammatical range and accuracy
10. What types of visual information might you be asked to write about? diagrams, bar charts, pie charts, tables, describe a process, how an object works, or a map
Board Race. There are 10 questions. All of the questions are from pages 22, 23, 24 and 25. Work as a team to find the answers in your book. Then write the answer on the board. Only one team member may go up to the board at a time. You may not bring this piece of paper or your textbook with you to the board. The first team to get the correct answers to all 10 questions up on the board will get a prize.
1. How many words must you write for Writing Task 1?
2. How many minutes should you spend on Writing Task 1?
3. Which is worth more points: Writing Task 1 or Writing Task 2?
4. True or False: You should try to explain the reasons behind the data in Task 1.
5. What style should you use for all IELTS essays?
6. What should you write in your first sentences?
7. What are two examples of some useful expressions to link your ideas?
8. True or False: You should write about everything you see.
9. What are the four criteria that the examiners use to grade Writing Task 1?
10. What types of visual information might you be asked to write about?
Answers:
1. How many words must you write for Writing Task 1? 150
2. How many minutes should you spend on Writing Task 1? 20 minutes
3. Which is worth more points: Writing Task 1 or Writing Task 2? Task 2
4. True or False: You should try to explain the reasons behind the data in Task 1. False
5. What style should you use for all IELTS essays? Formal academic style
6. What should you write in your first sentences? An overall description
7. What are two examples of some useful expressions to link your ideas? “in addition” and “however”
8. True or False: You should write about everything you see. false
9. What are the four criteria that the examiners use to grade Writing Task 1? Task achievement, coherence and cohesion, lexical resource, grammatical range and accuracy
10. What types of visual information might you be asked to write about? diagrams, bar charts, pie charts, tables, describe a process, how an object works, or a map
For instance, in the 45-54 age group 58% of people make purchases online, but 82% are Internet users, so almost 30% use the Internet for other activities as well.
|
The chart shows how the Internet is used by different age groups. It looks at both general use and online shopping.
|
More specifically, this is between 75% and 100% in the four younger age groups. However, it should be noted that there is a more dramatic difference with the 65-year-olds and over, where only 38% use the Internet. That is a 60% difference compared with the youngest age group.
|
A final point to mention is that most people use the Internet for other things as well as shopping.
|
One of the first things to note is that fewer older people use the Internet than young people.
|
Another thing to point out is that the number of people using the Internet does not vary very much between the age groups.
|
For example, 99% of 16-24-year-olds use the Internet compared with only 38% of 65-year-olds and over.
|
Talk with a partner. What information could you select to write about for this IELTS Task 1 Writing?
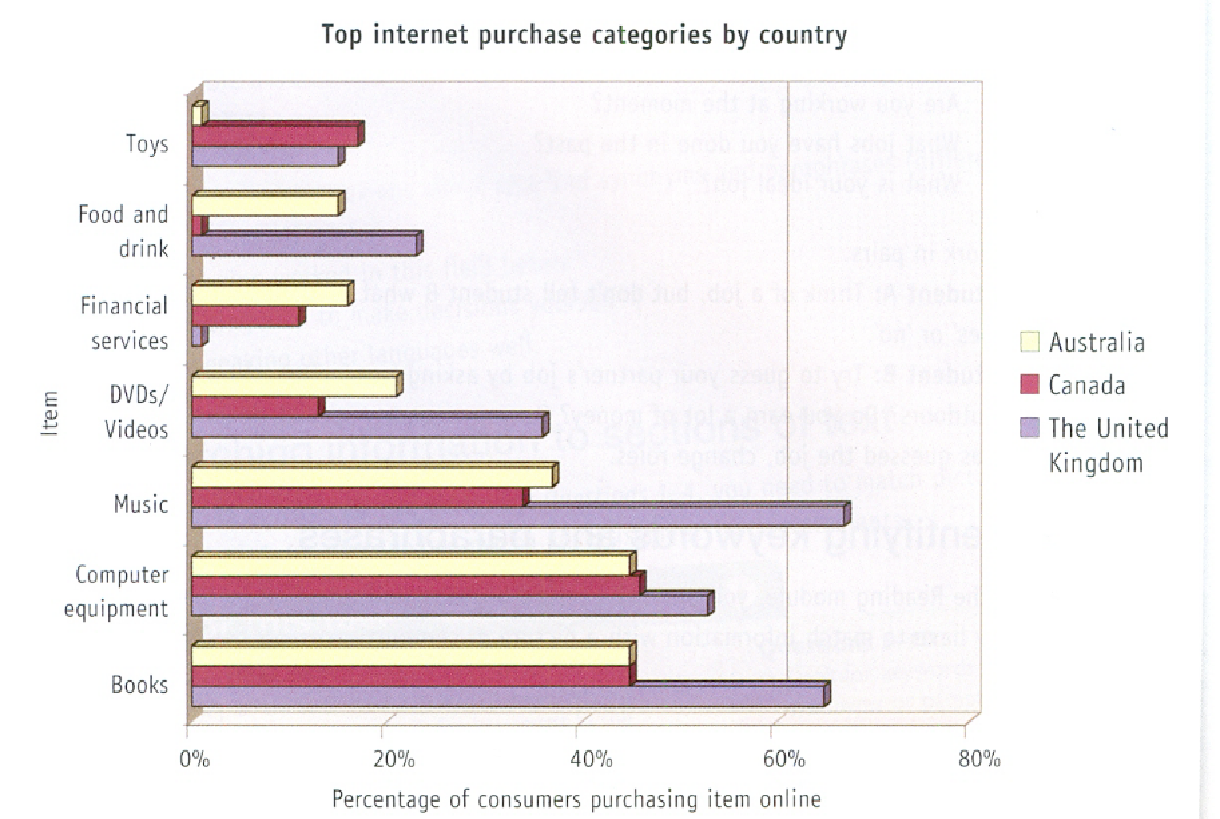
The chart below shows the different types of goods and services purchased online in Australia, Canada, and the United Kingdom in one year.
Summarise the information by selecting and reporting the main features, and make comparisons where relevant.
Your teacher will give you six strips. Match the strips to the descriptions.
Restate the question using different words.
|
Summarize the main trend of the graph.
|
State the first main point. (Topic Sentence)
|
Supporting details for first main point.
|
State the second main point. (Topic Sentence)
|
Supporting details for second main point.
|
Cut up strips and shuffle. Have students match strips to grid.
The chart shows a range of goods and services bought in one year by Internet shoppers in three different countries, namely Australia, Canada, and the UK.
|
We can see that the percentage of consumers making such purchases varied widely according to product/service and country.
|
One of the first things to note is that, generally speaking, a higher percentage of consumers in the UK made online purchases than in the other countries, with the exception of toys and financial services.
|
More specifically, Internet book sales in the UK exceeded those in Australia and Canada by almost a third. A similar comparison of music sales showed UK purchases to be almost double those of the other countries.
|
Another thing which stands out is that in all countries, purchases of certain products were much higher than others.
|
For example, in the UK 64% of consumers bought music online, compared with only 2% for financial services. On the whole, sales of entertainment goods and computer equipment were much higher than other goods and services. These sales were roughly two to three times higher than goods such as food/drink and toys.
|
The chart below shows the different types of goods and services purchased online in Australia, Canada, and the United Kingdom in one year.
Summarise the information by selecting and reporting the main features, and make comparisons where relevant.

Paragraph 1:
Restate the question using different words// Summarize the main trend of the graph
Paragraph 2:
Compare the three countries against each other
Paragraph 3:
Compare the purchase of goods and services against each other
|
The chart shows a range of goods and services bought in one year by Internet shoppers in three different countries, namely Australia, Canada, and the UK. We can see that the percentage of consumers making such purchases varied widely according to product/service and country.
One of the first things to note is that, generally speaking, a higher percentage of consumers in the UK made online purchases than in the other countries, with the exception of toys and financial services. More specifically, Internet book sales in the UK exceeded those in Australia and Canada by almost a third. A similar comparison of music sales showed UK purchases to be almost double those of the other countries.
Another thing which stands out is that in all countries, purchases of certain products were much higher than others. For example, in the UK 64% of consumers bought music online, compared with only 2% for financial services. On the whole, sales of entertainment goods and computer equipment were much higher than other goods and services. These sales were roughly two to three times higher than goods such as food/drink and toys.
(186 words)
|
Scrambled order
One of the first things to note is that, generally speaking, a higher percentage of consumers in the UK made online purchases than in the other countries, with the exception of toys and financial services.
|
We can see that the percentage of consumers making such purchases varied widely according to product/service and country.
|
For example, in the UK 64% of consumers bought music online, compared with only 2% for financial services. On the whole, sales of entertainment goods and computer equipment were much higher than other goods and services. These sales were roughly two to three times higher than goods such as food/drink and toys.
|
The chart shows a range of goods and services bought in one year by Internet shoppers in three different countries, namely Australia, Canada, and the UK.
|
Another thing which stands out is that in all countries, purchases of certain products were much higher than others.
|
More specifically, Internet book sales in the UK exceeded those in Australia and Canada by almost a third. A similar comparison of music sales showed UK purchases to be almost double those of the other countries.
|


No comments:
Post a Comment